10. AI AND MACHINE LEARNING VTU LAB | READ NOW
MACHINE LEARNING VTU LAB
Program 10. IMPLEMENT THE NON-PARAMETRIC LOCALLY WEIGHTED REGRESSION ALGORITHM IN ORDER TO FIT DATA POINTS. SELECT THE APPROPRIATE DATA SET FOR YOUR EXPERIMENT AND DRAW GRAPHS.
Program Code – lab10.py
from math import ceil
import numpy as np
from scipy import linalg
def lowess(x, y, f, iterations):
n = len(x)
r = int(ceil(f * n))
h = [np.sort(np.abs(x - x[i]))[r] for i in range(n)]
w = np.clip(np.abs((x[:, None] - x[None, :]) / h), 0.0, 1.0)
w = (1 - w ** 3) ** 3
yest = np.zeros(n)
delta = np.ones(n)
for iteration in range(iterations):
for i in range(n):
weights = delta * w[:, i]
b = np.array([np.sum(weights * y), np.sum(weights * y * x)])
A = np.array([[np.sum(weights), np.sum(weights * x)],[np.sum(weights * x), np.sum(weights * x * x)]])
beta = linalg.solve(A, b)
yest[i] = beta[0] + beta[1] * x[i]
residuals = y - yest
s = np.median(np.abs(residuals))
delta = np.clip(residuals / (6.0 * s), -1, 1)
delta = (1 - delta ** 2) ** 2
return yest
import math
n = 100
x = np.linspace(0, 2 * math.pi, n)
y = np.sin(x) + 0.3 * np.random.randn(n)
f =0.25
iterations=3
yest = lowess(x, y, f, iterations)
import matplotlib.pyplot as plt
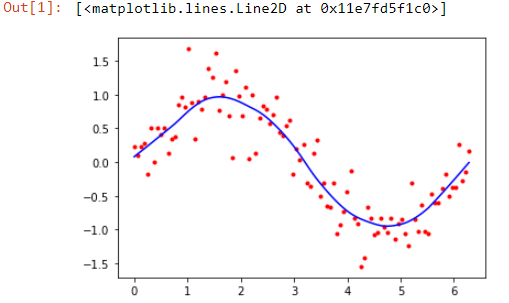
plt.plot(x,y,"r.")
plt.plot(x,yest,"b-")
Output